Backstory
It’s been just over 11 years since I did some statistics in 2011 on Petrol Prices. The short story is that there was a strong correlation between the price of brent crude oil and the price of petrol, leading to a formula to predict petrol prices based on the price of brent crude oil. This was not really surprising, as this is sort of “known”, but was good to confirm this for myself. However I was never really happy with the data in Excel. Also Over time all of the data sources used for the original have changed or gone.
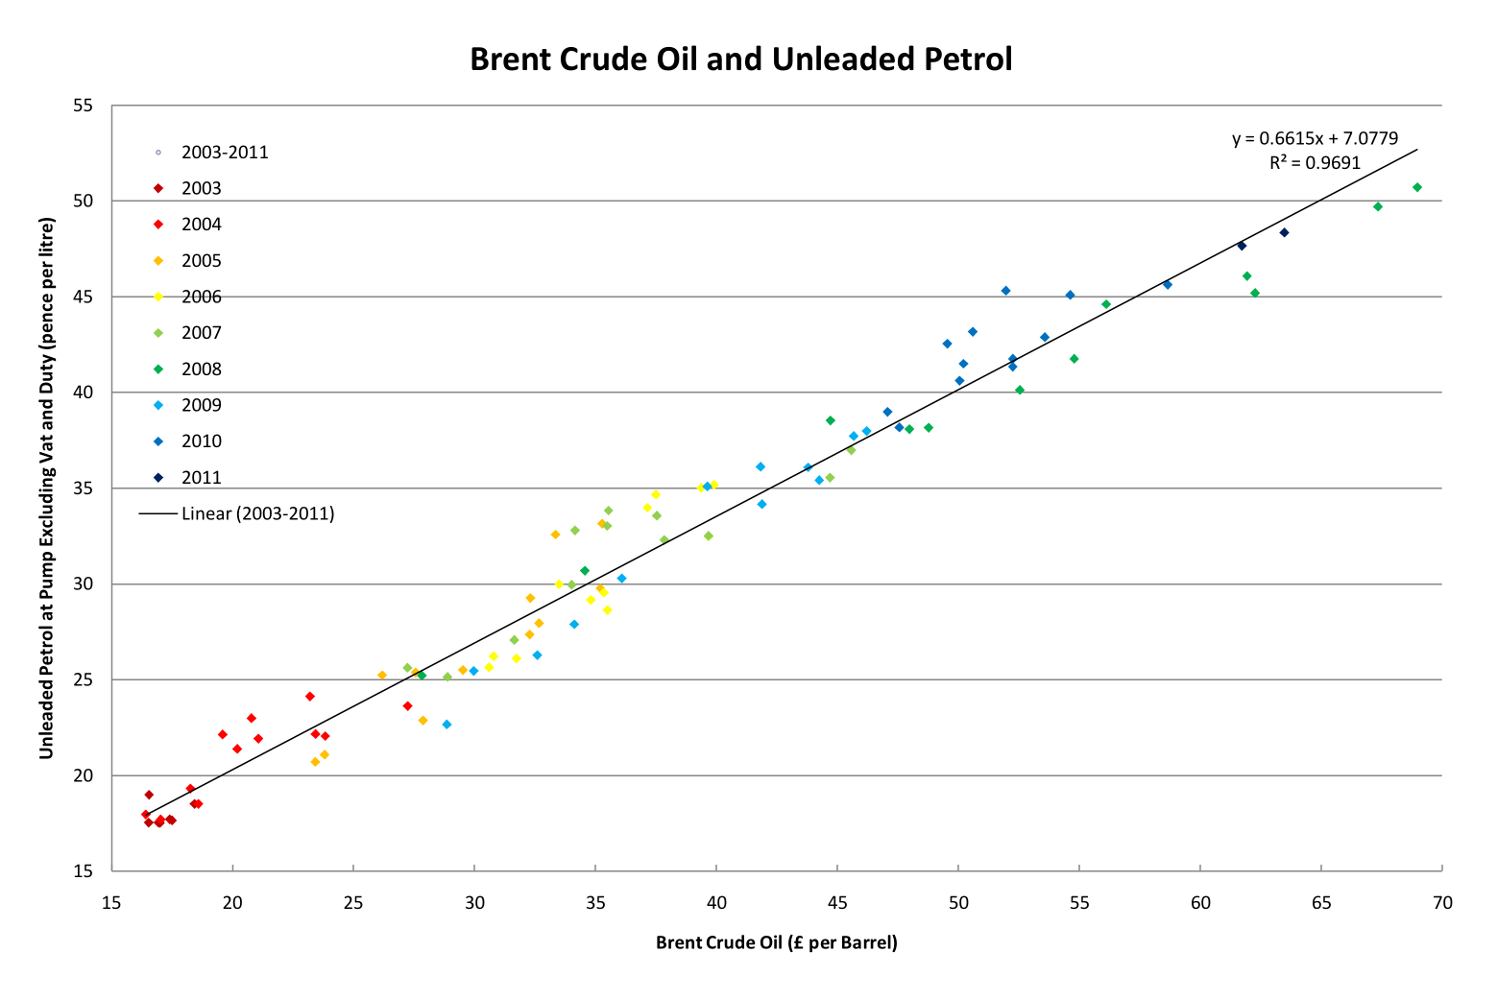
2011 graph
Analysis
As last time round, the first step was to find the data, for brent crude oild, historical exchange rates for gbp and usd, petrol prices and inflation data. The list I came up with is this:
- https://www.eia.gov/dnav/pet/hist/RBRTED.htm
- https://www.bankofengland.co.uk/boeapps/database/index.asp?first=yes&SectionRequired=I&HideNums=-1&ExtraInfo=true
- https://www.gov.uk/government/statistics/weekly-road-fuel-prices
- https://www.ons.gov.uk/economy/inflationandpriceindices/timeseries/l55o/mm23
Initially I used a Makefile to download and process the data, however it quickly grew into a monster, and ultimately I moved everything to a Python script. I creatively called this this grapher.py. It downloads the data, slightly massages it, joins all the data together, does some analysis and then creates the graphs. The intention is that this can be rerun in the future periodically to re-generate the graphs as ease, which will allow for showing the much higher petrol prices of June 2022. Currently this is done as part of the GitLab CI/CD process.
It also exports the final dataset to a csv file called prices.csv in case anyone wants to make their own graphs without the need for messing with other data sources. There is also prices-processed.csv which shows the numbers I calculated.
All of this is self contained in a repo: https://gitlab.com/thomasdstewart/ukpetrolprice/.
Also credit to Adbar for the top picture.
Graphs
Brent
Europe brent spot price FOB (USD per barrel) over time

Europe brent spot price FOB (GBP per barrel) over time

Europe brent spot price FOB (GBP per barrel) over time adjusted for inflation

Petrol
Ultra low sulphur unleaded petrol pump price (p/litre)

Ultra low sulphur unleaded petrol pump price (p/litre) excluding vat

Ultra low sulphur unleaded petrol pump price (p/litre) excluding vat and excluding duty

Tax and exchange rates
VAT over time

USD2GBP over time

Ultra low sulphur unleaded petrol duty rate (p/litre)

Ultra low sulphur unleaded petrol duty rate (p/litre) adjusted for inflation over time

Brent vs Petrol
Europe brent spot price FOB (GBP dollars per barrel) vs ultra low sulphur unleaded petrol pump price (p/litre)

Europe brent spot price FOB (GBP per barrel) adjusted for inflation vs ultra low sulphur unleaded petrol pump price (p/litre) excluding vat and excluding duty adjusted for inflation

Europe brent spot price FOB (GBP per barrel) adjusted for inflation vs ultra low sulphur unleaded petrol pump price (p/litre) excluding vat and excluding duty adjusted for inflation 2020-2022

In the spirit of a crazy formula, putting a trendline on the 2020-2022 data, a general formula can be calculated.
Remarks
Here are some remarks about the graphs that occurred to me:
- In 2022-04-01 brent crude oil was the minimum of $14.86 USD per barrel.
- In 2022-05-01 brent crude oil was the maximum of $87.74 USD per barrel.
- Petrol was cheapest in 2003-06-01 and most expensive in 2022-05-01.
- The 2022-06-01 figures will create new maximums.
- GBP getting weaker after 2016 due to Brexit can been seen.
- The increases in duty in 2011 that triggered my first analysis can be seen.
- Duty has stayed the same for a long time.
- The 5p drop in duty is comparatively large.
- When inflation it taken into consideration duty has decreased.
- There is still a correlation between brent crude oil and petrol.
- It seems that since for the last few years petrol costs more to produce from same price of brent crude oil.
- Petrol has doubled in price since I purchased my car.
- I like graphs.
- Some other interactive Javascript tool to create graphs from csv would be nice.
Last update: 2024-04-15
Build log: grapherlog.txt